What’s New in Office 365 in May 2019

Microsoft regularly unfurls new features and updates for Office 365’s assorted apps. So frequent are these updates that even regular users might not have had a chance to take advantage of the new additions just yet.
How to Cross-Reference Your Data Using VLOOKUP in Excel
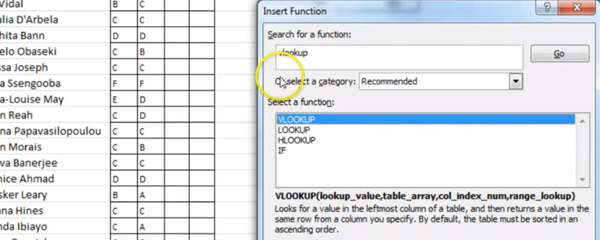
Learn how to use the VLOOKUP function to cross-reference data in this week’s time-saving two-minute video.
How to Create Better Pie Charts in Excel
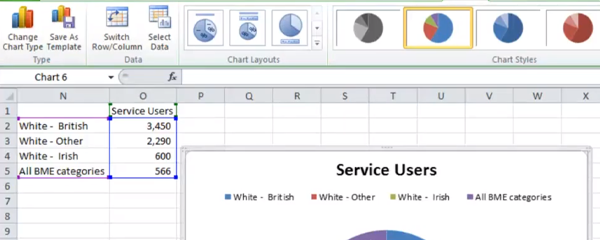
Learn how to create a pie chart that looks great while displaying your data in a clear way in this two-minute productivity video.
@Mentions: Make Collaborating via Email Fast and Easy

Focus on what matters by using the @Mentions feature, first introduction in Microsoft Outlook 2016 and available in Outlook 2019 and 365.
How To Use Styles To Format Your Documents With One Click
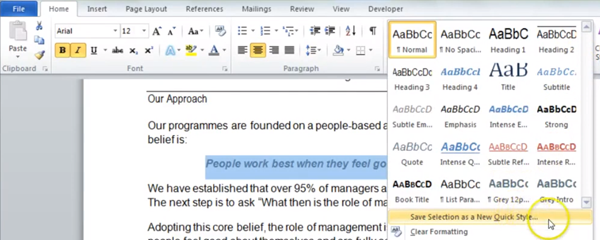
Learn how to create your own custom Style in Microsoft Word so you can format certain elements with just one click in our two-minute video.
How to Minimise Data Entry Mistakes in Excel
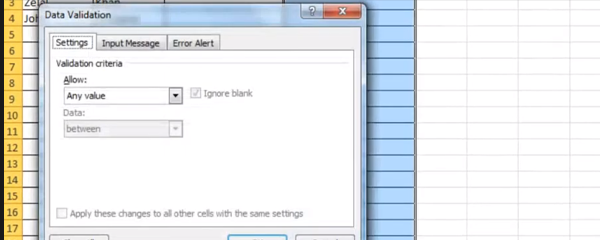
Learn how to create a drop-down menu in Microsoft Excel, using the Data Validation tool in our two-minute video. This is a great way to save time during data entry, minimise the risk of typos and mistakes, as well as ensure that there are no invalid entries.
How to Animate Your Charts in PowerPoint
Learn how to animate charts in your PowerPoint presentations in this two-minute video.
What is Power BI and Why Should You Use it?
Many of us use Excel for analysing and presenting data, and whilst we have become adept at VLOOKUPs and Pivot Tables, it is a challenge to combine large amounts of data from different sources.
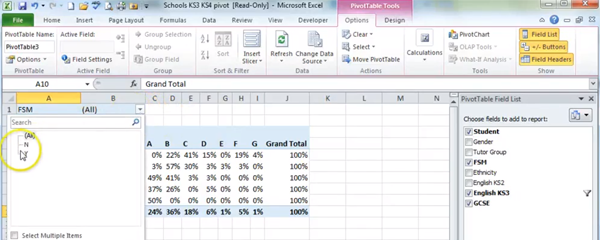
Pivot Tables: You’ve Got to Get Them in Your Life!

An essential feature of Microsoft Excel, Pivot Tables help organise and summarise user data. The easy-to-use tool can greatly assist with interpreting key trends and drawing conclusions from large data sets.
In this blog, Billy gives four reasons why Excel’s Pivot Tables are an essential tool.
How to Create a Pivot Table in Excel
Pivot Tables are the perfect way to sort and analyse your data in Excel. Find out how to create one in this two-minute video.


